I. Learn to think with Mermaid
Effective communicators meet people where they are. They give their audience the best chance to absorb the nuance of what they’re trying to say, sculpting their message to have the best chance of fitting into their audience’s understanding of the world.
You pick up a sense for when it’s helpful to add a visual aid to text — to summarize what you’re saying with a flowchart or sequence diagram. If you’re giving someone a quick overview of something, a chart is going to be more effective.
Lots of folks don’t tend to reach for charts because charts are hard. It’s easy to write text; it’s harder to go into Powerpoint or whatever and spend time messing with boxes and arrows.
Enter Mermaid. It’s a markup language for charts. With the right tooling, you can add these charts to your documentation, or write them in some editor and export an SVG or PNG to paste at someone or whatever.
Once you have this hammer, everything looks like a nail. Sequence diagrams to point out problems with an integration, ERDs to get everyone on the same page about a new DB table to support a new feature, flowcharts to quickly explain the way a part of the app currently work — these are all things I’ve done in the past handful of weeks.
If you start thinking with Mermaid, you’ll find you’re getting your point across more quickly and more effectively.
II. I hate to admit this, but:
Let’s say I need to send someone an ERD to show the relationship between some database tables. Let’s say I already have this largely in my head. With shame, this is what I often do:
- I tell The Robot to generate the ERD.
- I review what the LLM generated. Maybe I hand-massage it into the right shape, or maybe I follow up with the LLM to get it to be better.
- I use my editor to export an image and send that along.
I hate content that tells me how to “use AI,” but I’m going to do that here: the magic words tend to be “create a Mermaid chart that…” and then make sure that the output area for the LLM makes it easy to view and export the chart.
III. Bonus tip: use tl;draw
If you’re explaining something, use a whiteboard. Whiteboarding something is a kind of performance: your audience is given a greater chance to visually locate and develop concepts, and if you make the whiteboarding something everyone can participate in, you’ll get to the heart of misunderstandings much more quickly.
tl;draw is amazing. It’s a free, online whiteboarding tool. It does exactly what you want. It’s got post-it notes. I love it. As soon as I find myself explaining something that’s more than one layer deep, I fire up tl;draw and paste a link at someone. (Shout-out to Myles for pointing me at tl;draw.)
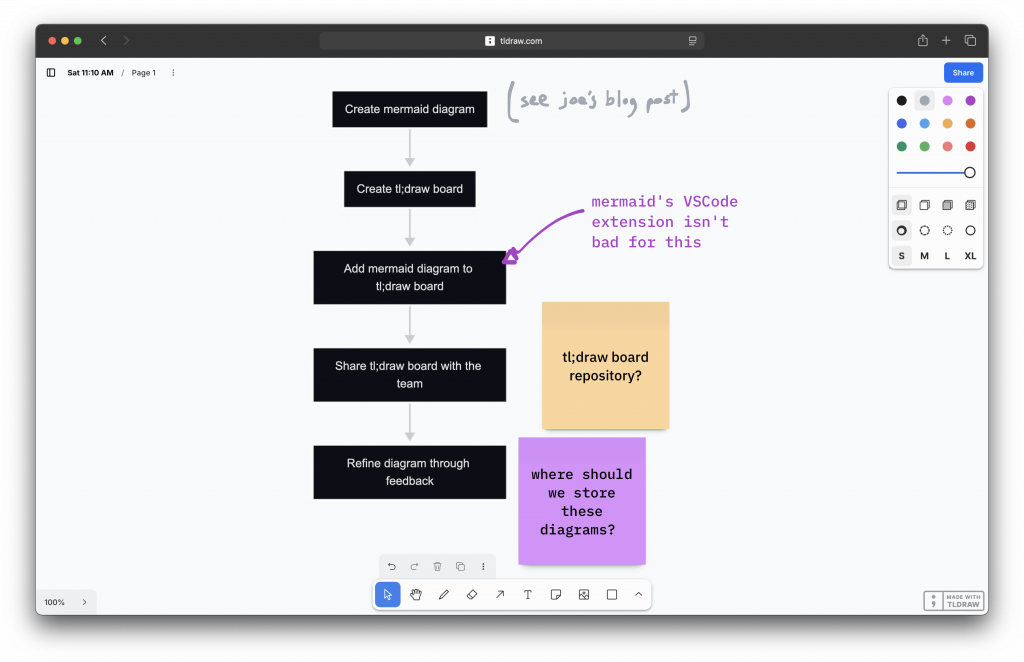
tl;draw also supports vector and raster images. I’ve had a lot of success generating a SVG chart via Mermaid, pasting that into tl;draw, and getting the team to scribble all over it.