tl;dr: I believe HN Who is Hiring? posts are down; scroll to the bottom for the chart, code lives here.
Hacker News. The Orange Site. Since April 2011, it’s had a thread every month, which dares potential employers to answer one question: who is hiring?
I take a quick skim through this thread every month. Not only does Fastmail (who are hiring, by the way) post there, but you can glean a lot of interesting information from the posts that are being made here. I subscribe to an RSS feed for this, which makes flipping through the comments very easy.
The hunch
Reading this month’s thread, I got a hunch:
- Economic pessimism is way, way up this month
- Therefore hiring might be down this month
- Which would be reflected by the number of organizations posting in this month’s HN Who’s Hiring thread being down
In describing this theory to my colleagues, I drew a chart on the whiteboard that looked something like a Loch Ness Monster:
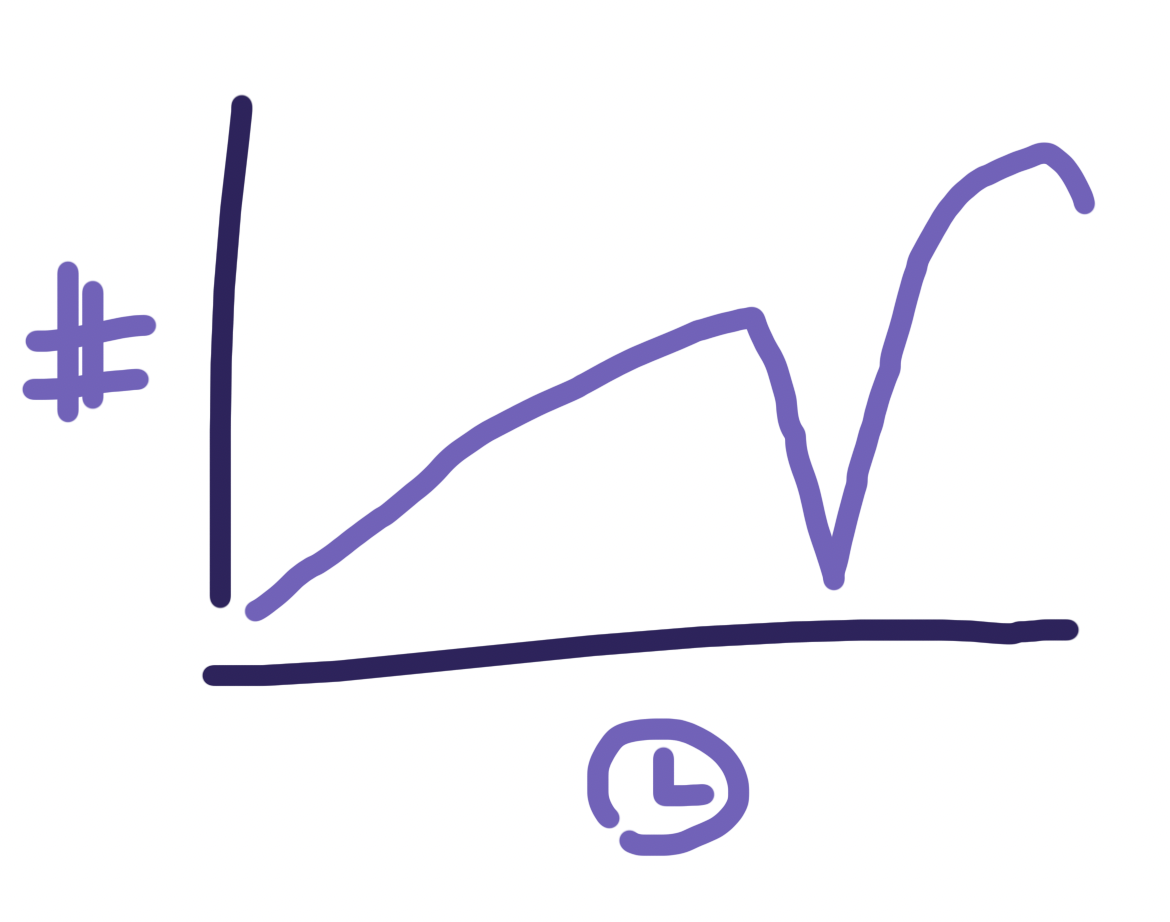
That is, we generally expect the number of posts to go up over time, because HN’s popularity has gone up; with notable exceptions for the first few months of the pandemic, and the slow-down we’re going through right now.
Is the metric “number of top-level comments in HN Who is Hiring threads” a good indicator of how companies are hiring in general? I’ll let you decide.
Methodology
There is an official HN API: https://github.com/HackerNews/API. So, really, all we have to do is fetch a lot of data, store it in a format we can retrieve, then mess around with it:
- Go create a list of the “Who Is Hiring” posts. I could have done this in a less manual fashion, but I just made a list from the account which posts the posts.
- Go get all of those posts; mark their publish time, and their direct descendant comments (in the API, “kids”).
- Go get all the comments, and their publish times. This took a while.
- Make a chart.
When you look at it like that, this all becomes a simple matter of programming. I did that programming! You can find the programs here.
The result
So, assuming that there wasn’t any weirdness with the API, we see the following shape. The darker top line is number of non-deleted posts after three days; the bottom line is after one day.
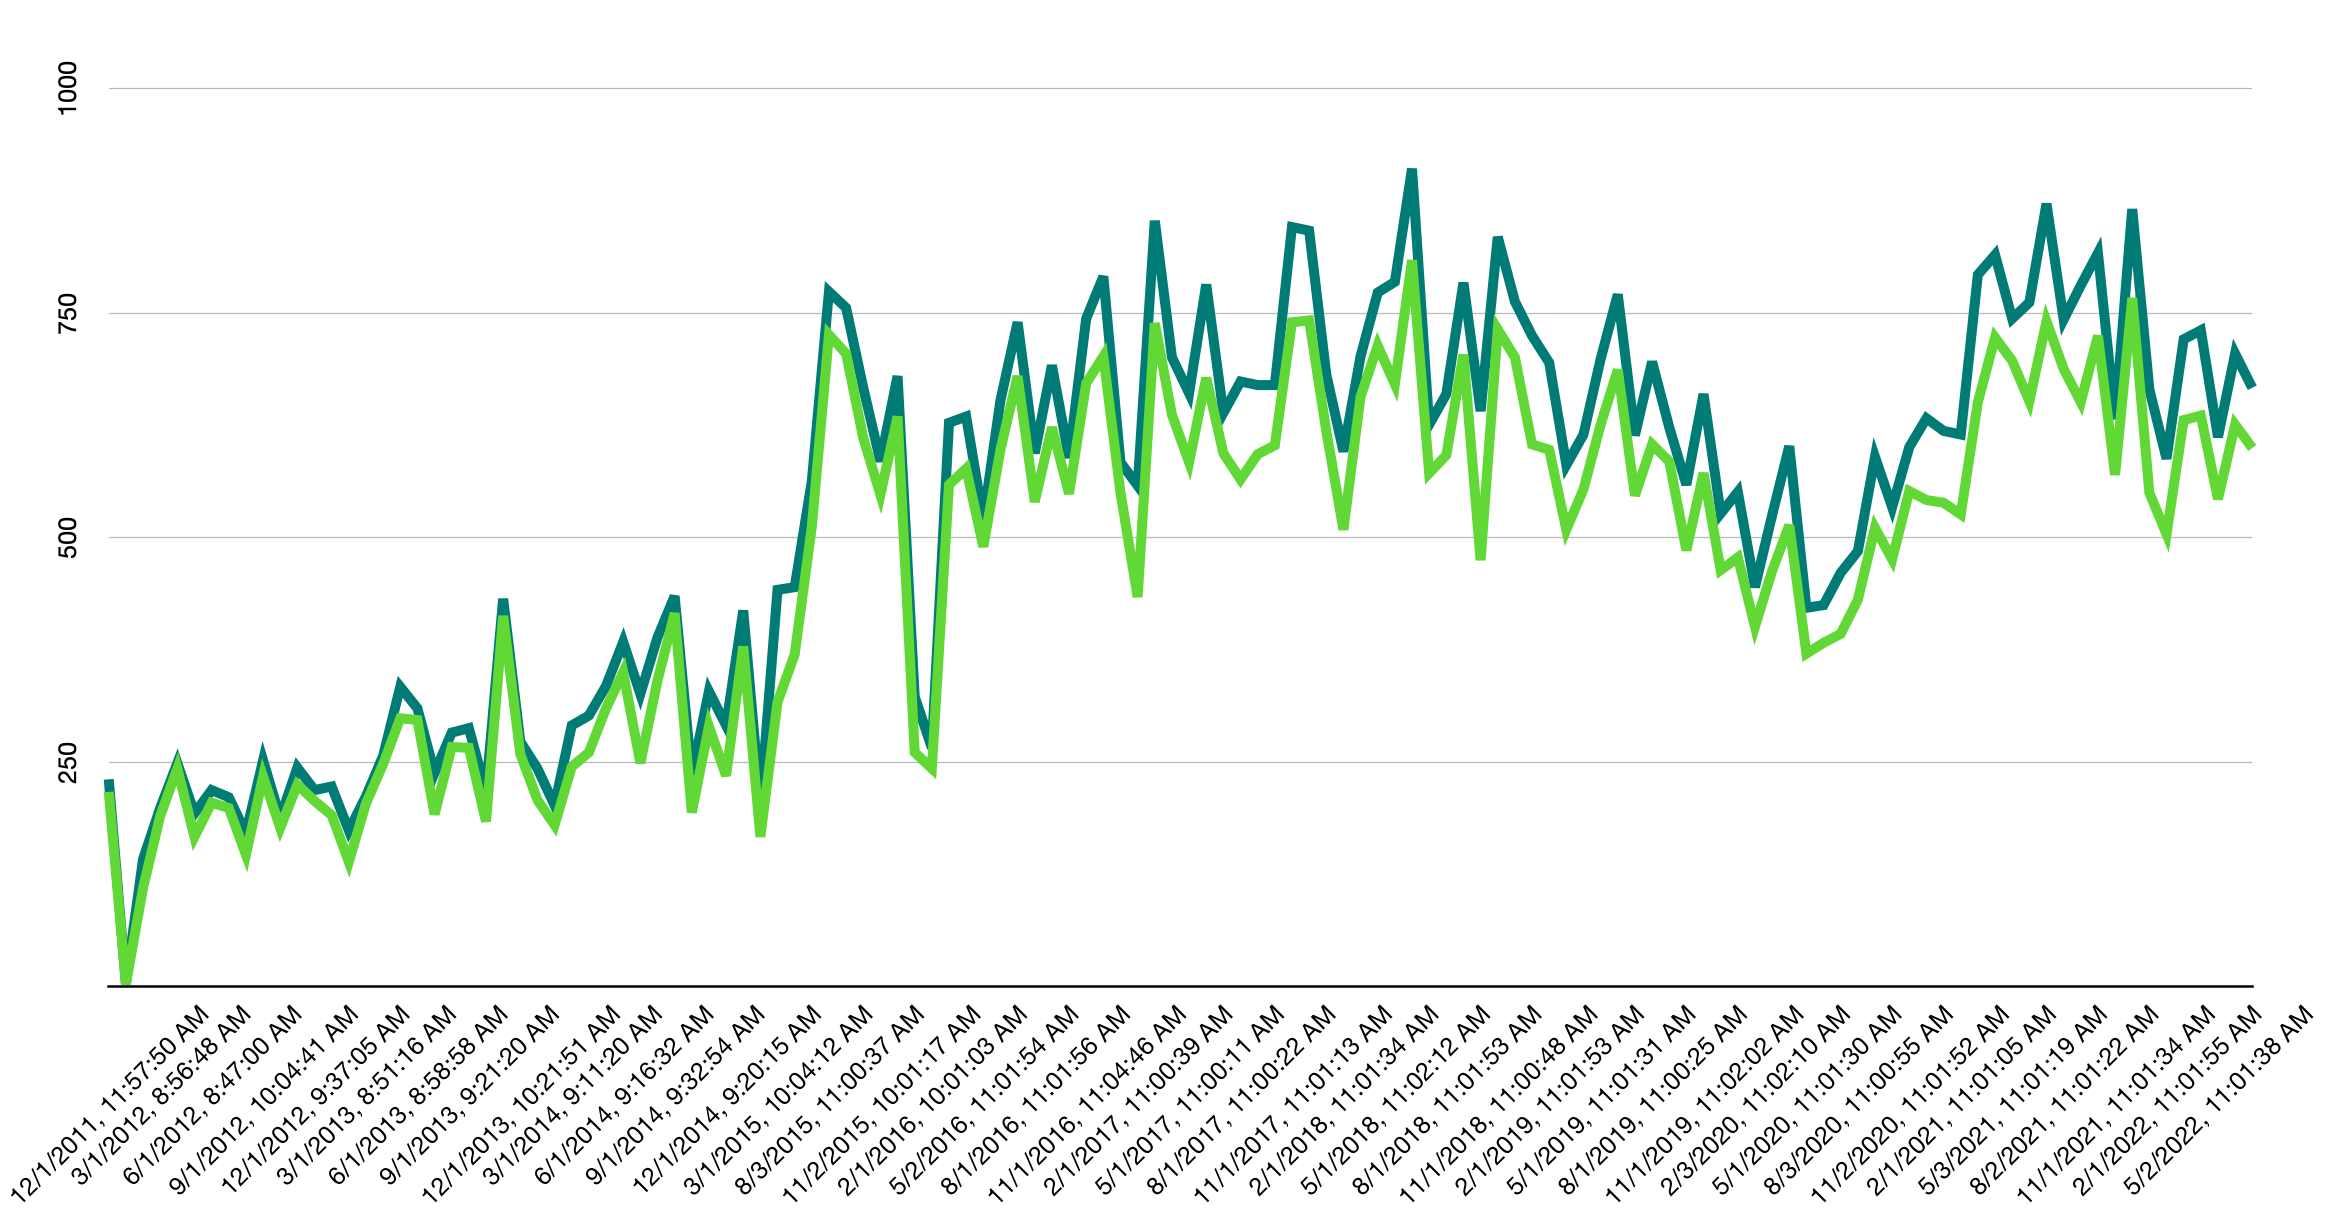
So my hunch that posts are down this month doesn’t seem to be strictly true; unless someone points out a flaw with my methodology, it’s safe to assume that new job posts on HN have been down at least the past handful of months.
